


When Everything Worked

2025 shined on diversified investors, with positive absolute returns across many major asset classes- domestic equities, international equities, fixed income, and commodities. Market performance was shaped by a combination of moderated economic growth, a transition in monetary policy, and persistent concentration within equity leadership. The chart below shows the returns and the five-year volatility (using standard deviation) for the asset classes listed.
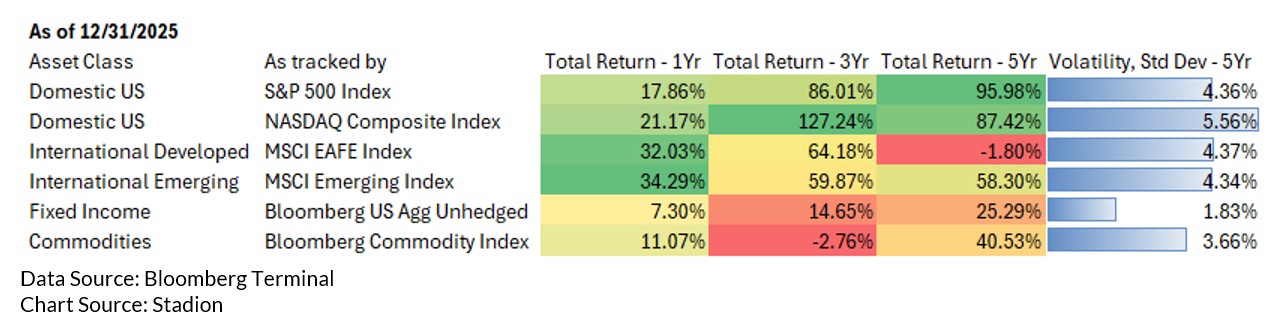
As shown, U.S. equities posted another year of gains. Those were led primarily by large-cap stocks as performance was increasingly concentrated among a small number of mega-cap companies with exposure to advanced technology like artificial intelligence and cloud infrastructure.
At the index level, the S&P 500 Index and NASDAQ Index both performed very well, but when broken down by sector it becomes obvious much of the growth is coming from the technology sector. This concentration became one of 2025’s defining features and may continue to be a theme in 2026.
International equity outperformed domestic stocks with a strong, broad-based rally during 2025. Both developed and emerging markets more than tripled the returns each posted for the 2024 calendar year, as tracked by the MSCI EAFE Index and the MSCI Emerging Index. Emerging markets were supported by the weaker U.S dollar, but the -buoyancy enjoyed by developed markets had less obvious benefactors.
Unlike domestic equities, international developed regions benefited from their broad participation in value and cyclical sectors like financials, industrials, and energy. It is difficult to say if this broad participation will continue to support international developed vehicles in 2026, but if domestic rate cuts continue, foreign markets could benefit thus easing any strain caused by weak global liquidity.1 In similar fashion, market performance for emerging market equities could continue to hinge on the strength of the U.S dollar.
Economically, the macro narrative remained center stage as policy attempted to address changes in growth, inflation, and the labor market. Through the first half of the year the Federal Reserve maintained its restrictive stance, then during the latter half, began making rate cuts. This was a very notable transition in monetary policy. This change had some influence in moderating economic growth and labor markets gradually softened without signaling recessionary stress. Additionally, inflation continued to decelerate, and the transition reinforced market expectations that policy rates had peaked, providing support in both equity markets and fixed income markets.
Fixed income played a supportive role in portfolios in 2025, and more than just a defensive allocation. Debt markets were adaptable to the changing interest rate environment by shifting toward income generation. Moreover, as the rate cuts came into focus, short and intermediate duration credit sectors saw inflows while long-term strategies and treasuries saw more outflows.2
This behavior typically signals a demand for high-yield and securitized credit while also reflecting uncertainty around the longer-term path of rates. Credit markets remained resilient, supported by limited default activity. With private markets seeing significant inflows, private debt and semi-private debt vehicles could be a defining feature of 2026.
Commodities performed as an inflation hedge and a source of diversification for investors. Namely, gold and other precious metals experienced significant inflows and worked to protect against the weaker U.S dollar. Energy markets were supported by political tensions and the ongoing tariff conversations. Industrial metals were supported by the growth in technology and automotive demand. This made commodities a meaningful source of return for diversified portfolios in 2025.
In sum, 2025 highlighted the benefits of diversification across asset classes, as positive returns were realized in equities, fixed income, and commodities alike. Broad participation in international equities, selective credit allocation in fixed income, and strategic exposure to commodities supported portfolio performance. Looking ahead to 2026, equity leadership remains concentrated, and credit flows continue to reflect uncertainty about the long-term path of interest rates. However, short-term monetary policy uncertainty has declined as the Fed’s transition away from its restrictive stance has seemingly taken root.
Hazel Allen
Portfolio Management Analyst
1https://www.goldmansachs.com/insights/articles/global-stocks-are-forecast-to-return-7-point-7-percent-annually-in-coming-decade
Published November 21, 2025; Accessed January 2, 2026
2https://www.marketwatch.com/story/family-offices-favor-this-area-of-bonds-ahead-of-potential-fed-rate-cuts-goldman-sachs-finds-55fc2a16?utm
Published September 10, 2025; Accessed January 2, 2026
Standard deviation establishes the average spread of individual values from the mean for a group.
Large-cap stocks represent companies with a market capitalization over $10 billion.
Mega-cap stocks represent companies with a market capitalization over $200 billion.
The S&P 500 Index is the Standard & Poor’s Composite Index of 500 stocks and is a widely recognized, unmanaged index of common stock prices.
The NASDAQ Composite is a stock market index of the common stocks and similar securities listed on the NASDAQ stock market and it is highly followed in the U.S. as an indicator of the performance of stocks of technology companies and growth companies.
The MSCI EAFE Index (Europe, Australasia, Far East) is an unmanaged free float-adjusted market capitalization index that is designed to measure the equity market performance of developed markets, excluding the US & Canada.
The MSCI Emerging Markets Index consists of 23 economies including Brazil, Chile, China, Colombia, Czech Republic, Egypt, Greece, Hungary, India, Indonesia, Korea, Malaysia, Mexico, Peru, Philippines, Poland, Qatar, Russia, South Africa, Taiwan, Thailand, Turkey and the United Arab Emirates. The MSCI is a float-adjusted market capitalization index.
The Reports' commentary, analysis, opinions, advice, and recommendations represent those of Stadion Money Management and are subject to change at any time without notice. The opinions referenced are as of the date of publication and are subject to change due to changes in the market or economic conditions and may not necessarily come to pass Stadion reserves the right to modify its current investment strategies based on changing market dynamics or client needs. This document may contain certain information that constitutes “forward-looking statements” which can be identified by the use of forward-looking terminology such as “may,” “expect,” “will,” “hope,” “forecast,” “intend,” “target,” "believe,” and/or comparable terminology. No assurance, representation, or warranty is made by any person that any of Stadion’s assumptions, expectations, objectives, and/or goals will be achieved. There is no guarantee of the future performance of any Stadion portfolio. This material is for information use only and should not be considered financial advice. The data presented has been gathered from sources believed to be reliable; however, their accuracy, completeness, or reliability cannot be guaranteed. We make no warranties and bear no liability for your use of this information.
Stadion Money Management, LLC ("Stadion") is a registered investment adviser under the Investment Advisers Act of 1940. Registration does not imply a certain level of skill or training. More information about Stadion, including fees, can be found in Stadion's ADV Part2, which is available upon request.
Past Performance is no guarantee of future results. Investments are subject to risk, and any of Stadion’s investment strategies may lose money.
SMM-2601-28